
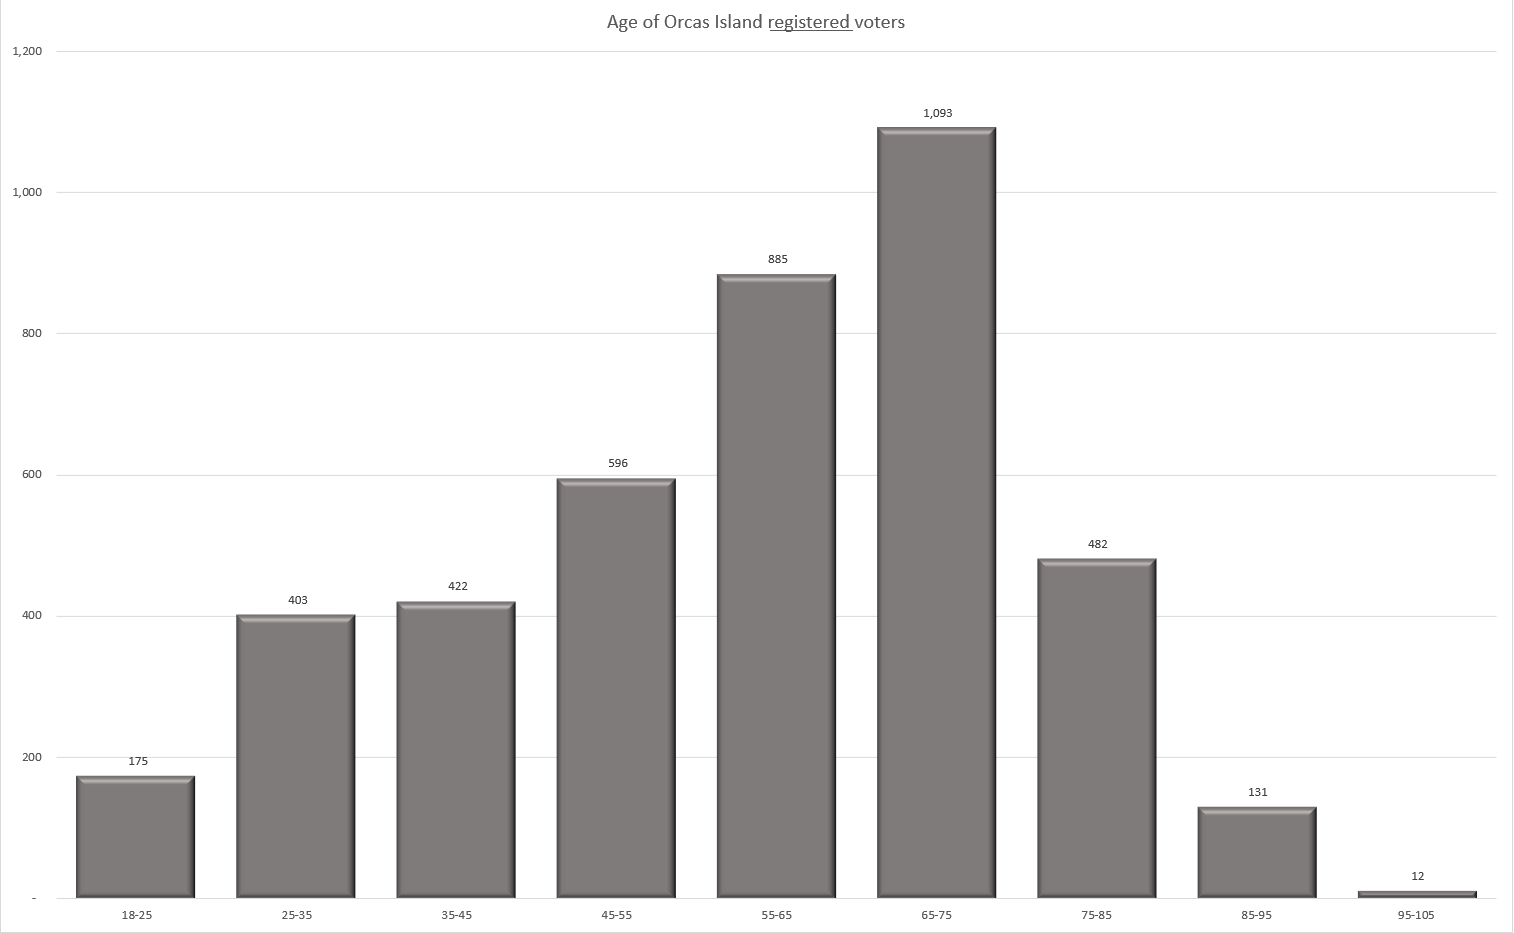
Orcas Island voter demographics
Sources:
Click to enlarge – back button to return
4197 – Total number of registered voters as of February 2018
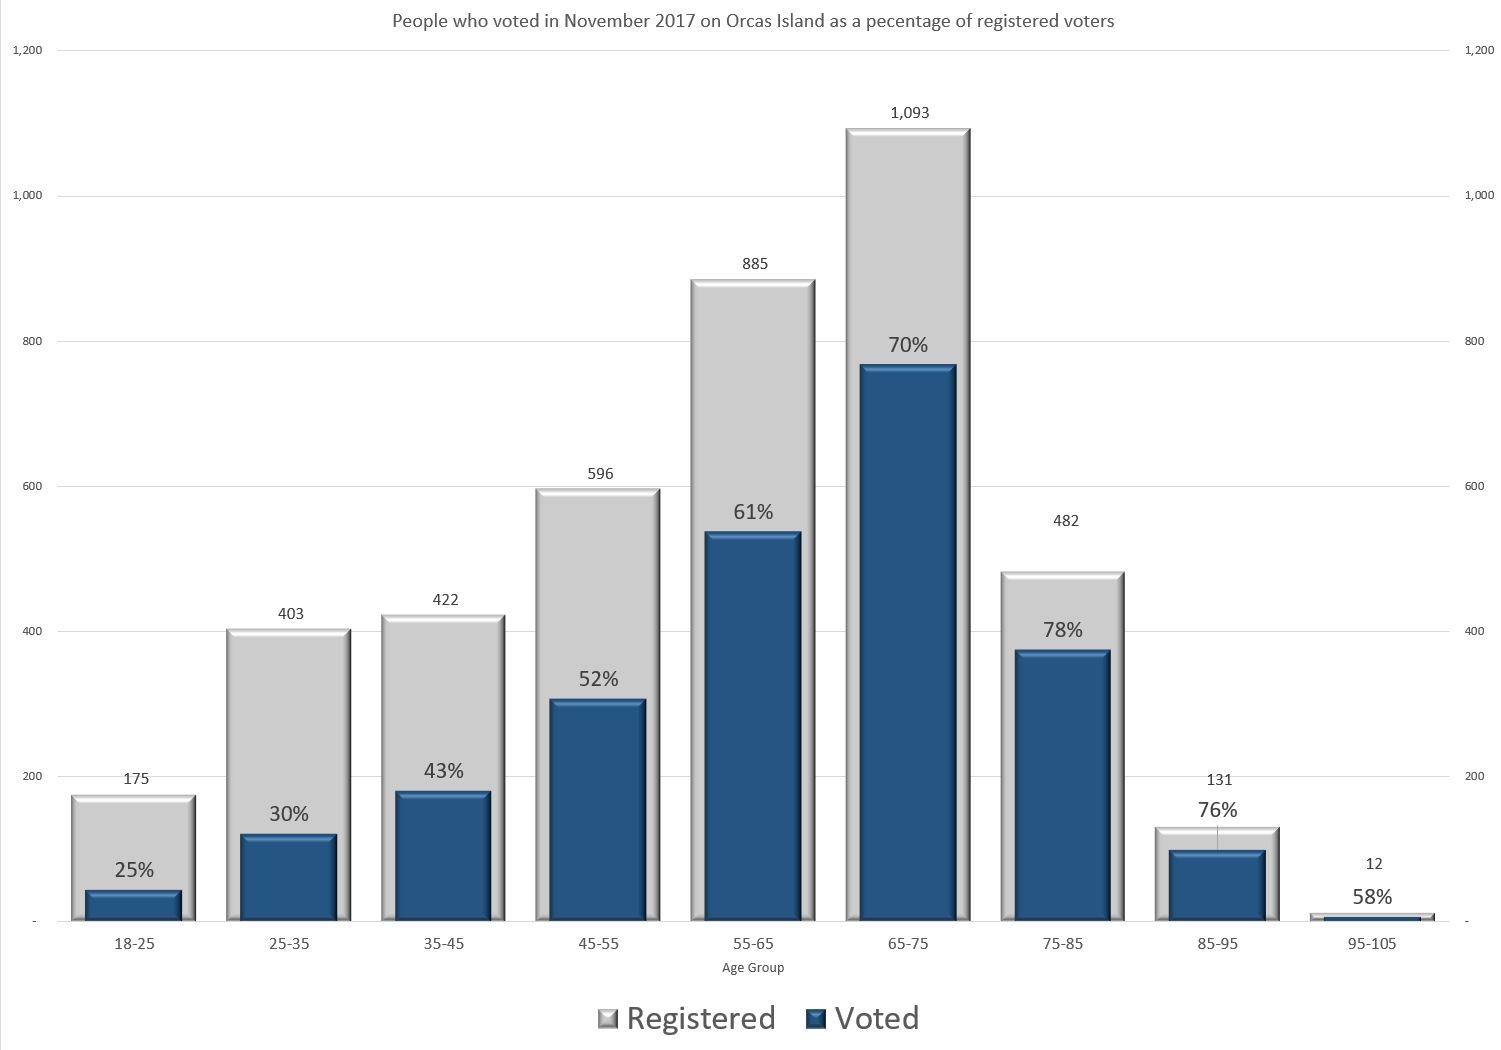
2,442 – Number who voted in the last general election – November 2017 – 58%
3,607 — Number who voted in the November 2016 election – 86%
997 – Number required to vote in any special election held in 2018 in order for the vote to be valid. This is 40% of the November 2017 number of voters. Think of the 40% as the necessary number to have a quorum of voters.
Since the November 2017 election did not have any national candidates, participation was lower.
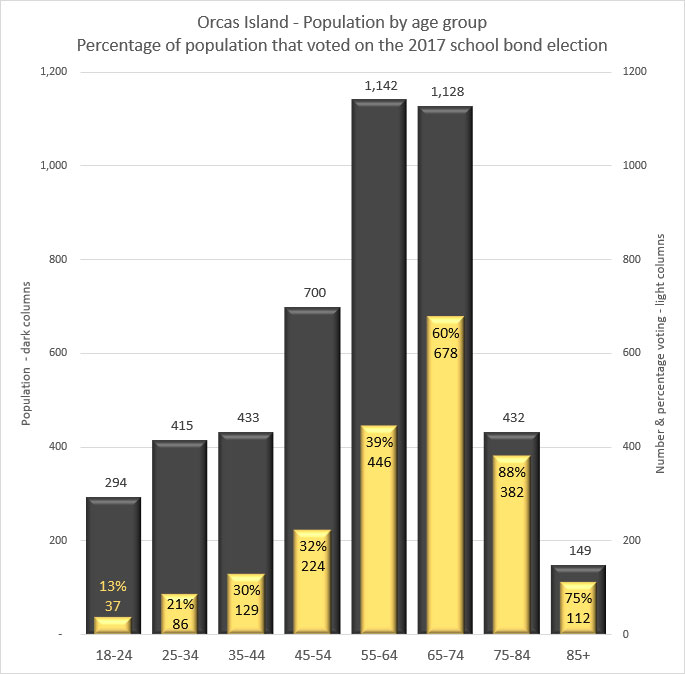
This graph looks at the 2017 special election which was about a large school bond. It should have been of interest to anyone who has school age children and who pays property taxes.It compares the percentage of the people voting to the population. Note that the previous graph looked at the ratio to registered votes which is a sub-set of the population.
Update 10/01/18