Do the different asset groups see the proposed hospital district differently?
We asked people to tell us how much they expected the proposed hospital district to cost them in new taxes.
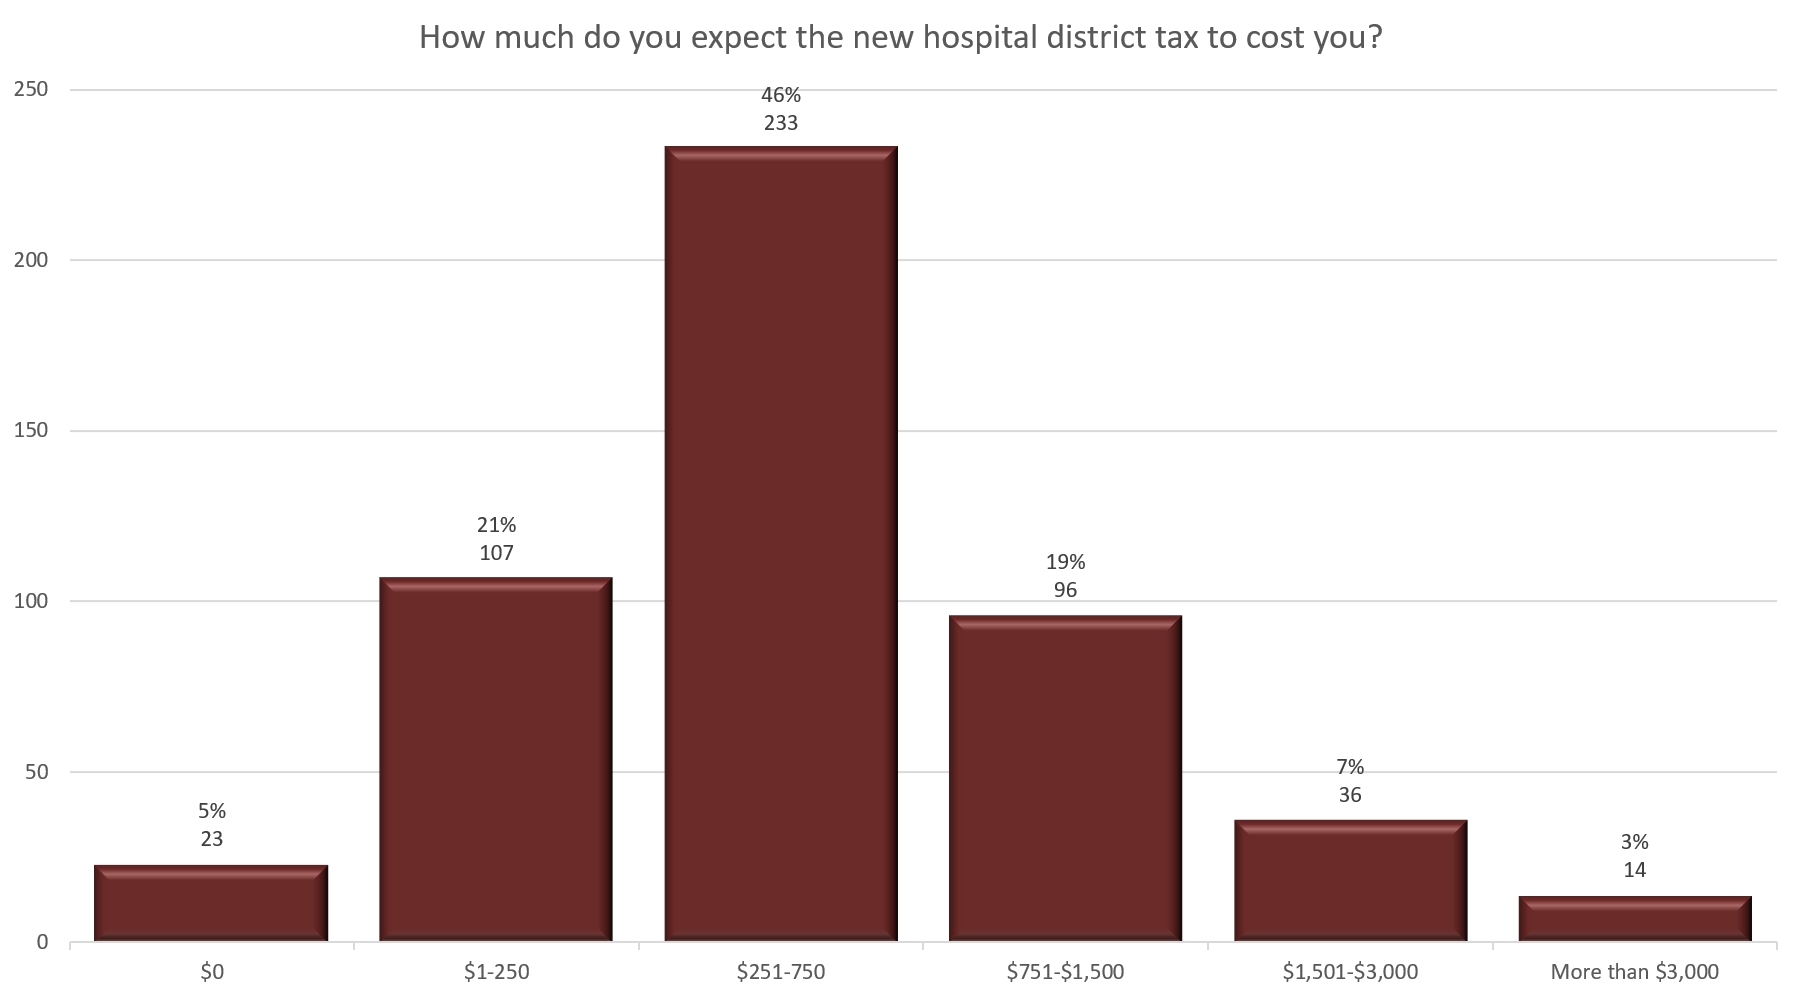
Graph 1 Click the graph to enlarge; back to return here.
Almost half of the respondents expect the hospital district to cost them between $250 and $750 a year.
Then, we looked at if the amount of tax they’d pay affected how they planned to vote.
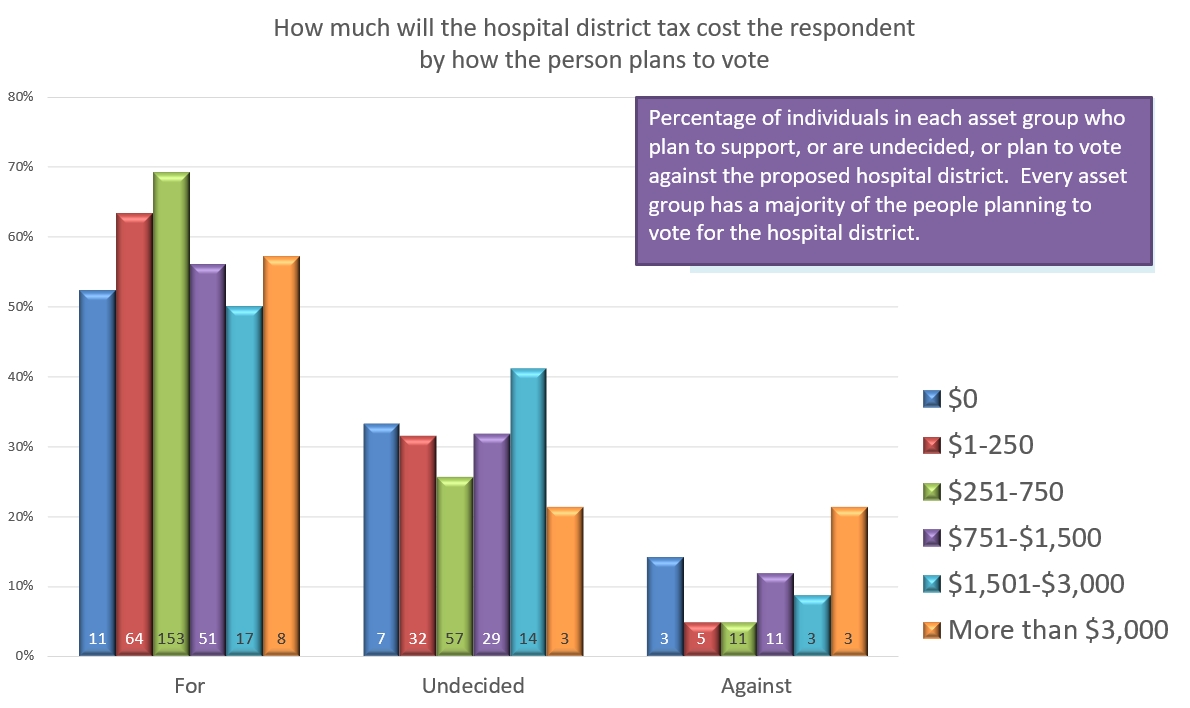
Graph 2 Click the graph to enlarge; back to return here.
The majority of people in all asset groups plan to vote for the proposed hospital district.
The numbers in the bottoms of the columns on Graph 2 are the number of people. The height of each bar reflects the percentage of people in that asset group who indicate how they may vote.
The number of people in Graph 1 includes all respondents, including those who do not plan to vote. The numbers in Graph 2 reflect only those who plan to vote. There are 27 people who completed the survey and do not plan to vote.
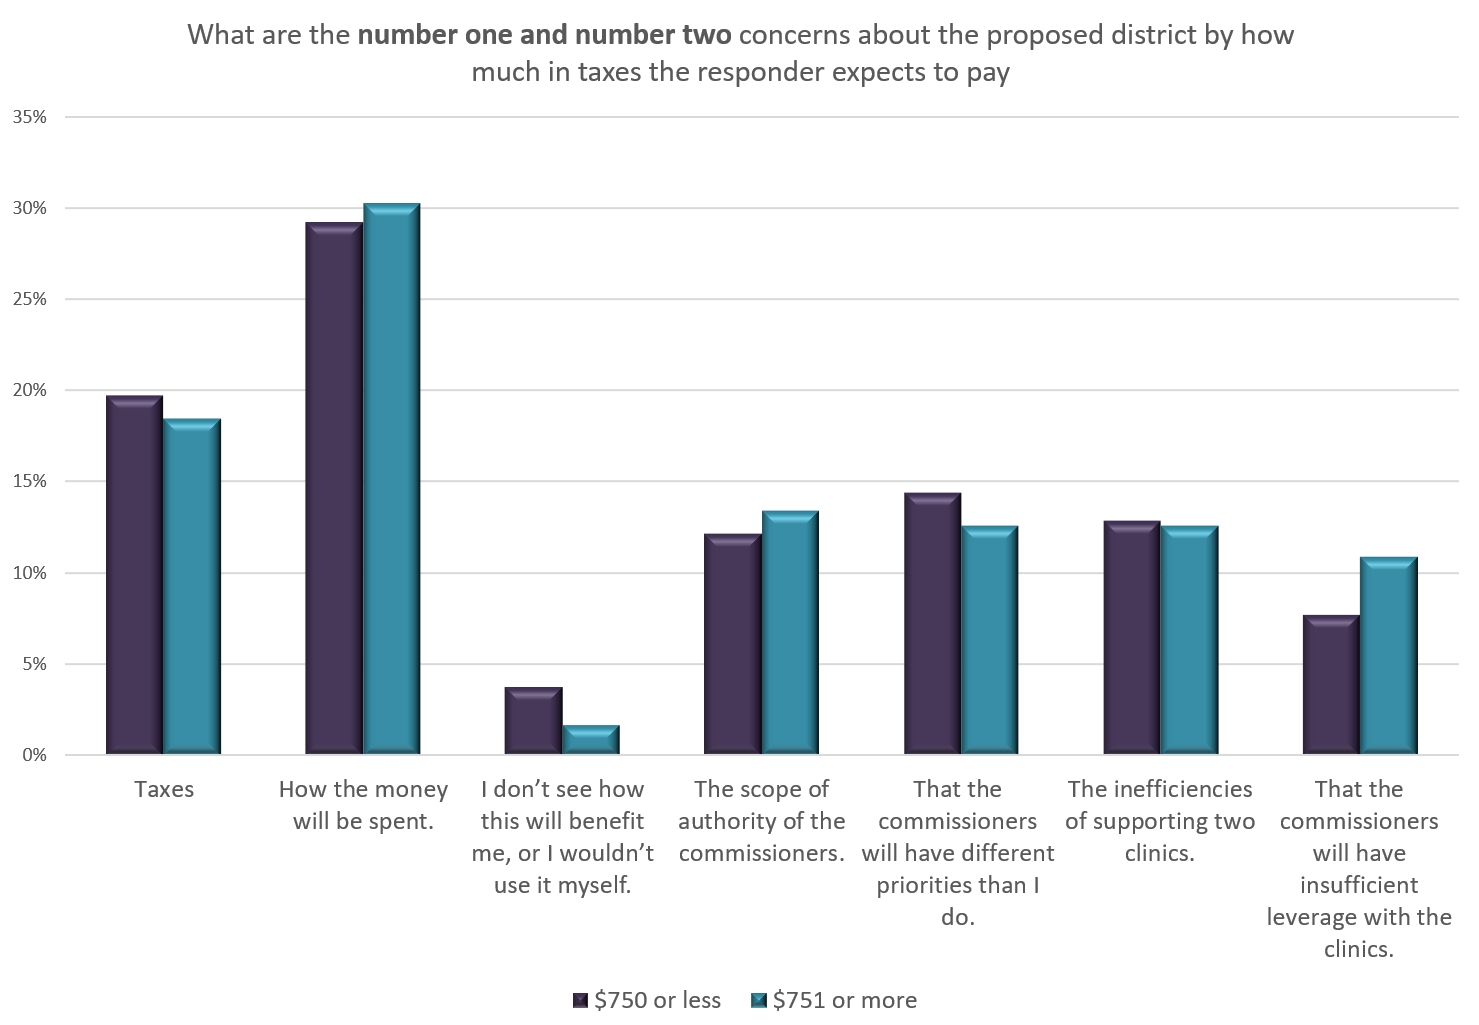
Next, we looked at what the number one and number two concerns for a respondent are by asset group. For clarity, we have reduced the groups into those who expect to pay more or less than $750 in new, PHD-related taxes. In other words, if you pay more or less taxes, does it affect what you are most concerned about? The height of the bars in this third graph are affected by whether a person ranked a concern as a 1 or a 2. If an idea was not a concern or if it was ranked 3, 4, 5, 6, or 7, it does not show here. The purple bars add up to 100%, and the teal bars add up to 100%.
In short, the amount of money a person expects to pay in taxes has little affect on what they are most concerned about.